The latest from Doug Short at Advisor Perspectives...
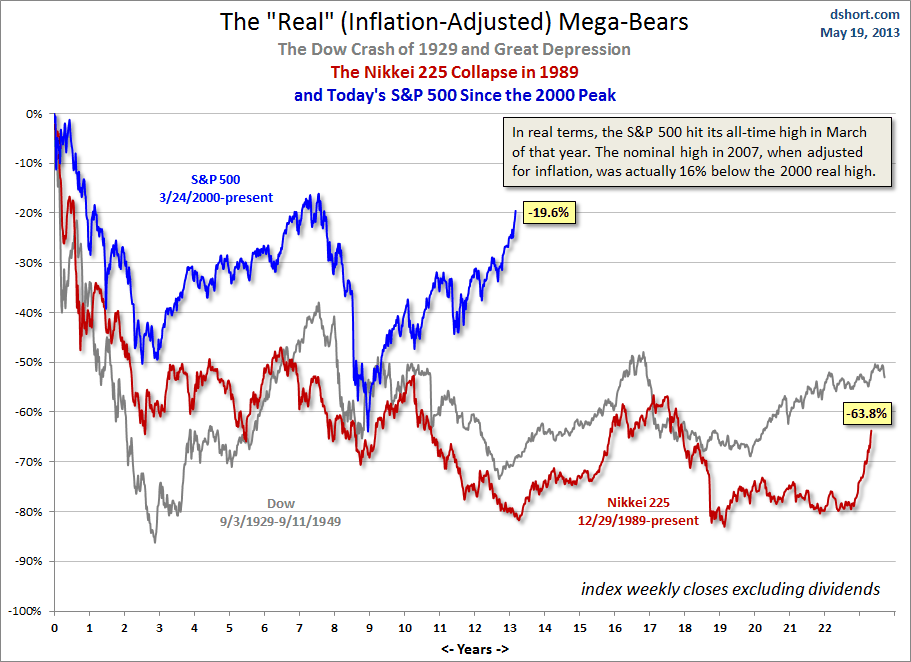
It's time again for the weekend update of our "Real" Mega-Bears, an inflation-adjusted overlay of three secular bear markets. It aligns the current S&P 500 from the top of the Tech Bubble in March 2000, the Dow in of 1929, and the Nikkei 225 from its 1989 bubble high.
The chart below is consistent with my preference for real (inflation-adjusted) analysis of long-term market behavior. The nominal all-time high in the index occurred in October 2007, but when we adjust for inflation, the "real" all-time high for the S&P 500 occurred in March 2000.
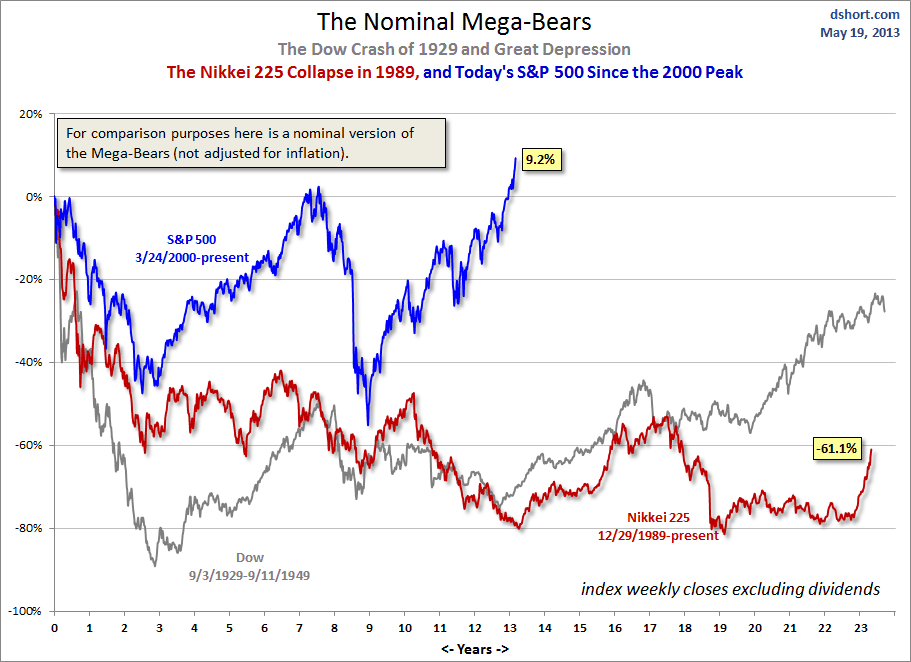
Here is the nominal version to help clarify the impact of inflation and deflation, which varied significantly across these three markets.
See also my alternate version, which charts the comparison from the 2007 nominal all-time high in the S&P 500. This series also includes the Nasdaq from the 2000 Tech Bubble peak.
Please follow Money Game on Twitter and Facebook.
Join the conversation about this story »
See Also:
- Bearish Andrew Smithers Sees 10% Stock Rally As Companies Buy Back Shares -- A Selling Opportunity!
- AFTER QADDAFI: Oil Prices Will Tank, Stock Prices Will Soar
- Wow! Philly Fed Index Comes In At Catastrophic -30.7


No comments:
Post a Comment
Please leave a comment after signing into this blog and receive my latest newsletter about my thoughts and feelings and follow us on twitter at https://twitter.com/AceFinanceNews
Thank you Ian {Editor}